‘Query as a Web Service’ (QaaWS) is a client tool that was first made available with BusinessObjects XI R2. Now with XI 3.0 and 3.1, it is quickly becoming a commonly used client tool because of its ability to interface with Xcelsius 2008 and convert your static presentations into dynamic and live visualizations.
The following set of screen shots will walk you through the process of creating a simple application that integrates QaaWS and Xcelsius 2008 within BOE XI 3.1.
This example will include two QaaWS queries; one to provide the countries for our ListBox and a second query that will accept the selected country and provide the data for our chart. Let’s begin by opening QaaWS and creating a new Web Service query.
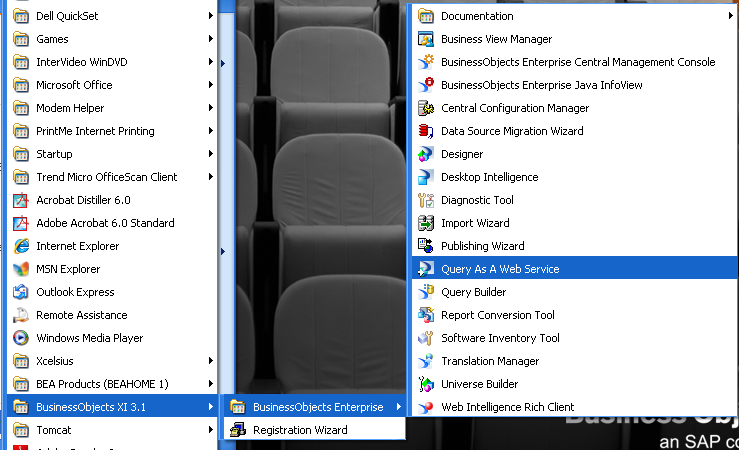
Launch the QaaWS Tool


