
I was recently working on a Personal Finance Dashboard and had to rank the returning data in descending order based on spending. I know this can be done on the query side using the sort functionality, however, I was trying to apply ranking on a subset of data returning from a main query, which was not in the desired sort order. In the end it was pretty straight forward.
XLF File
Download the XLF file and refer to it as you go through the steps
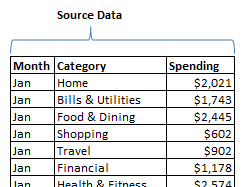
Source Data (B9:D204)
For demo sake, I’ve imported a small sample source data into the Excel model. This is the same data as that of the main query that I was talking about earlier.
Filtered Rows (G10:I26)
Drop in any Selector component with “Filtered Rows” capability. Configure it to insert filtered rows based on “Month”. Since the number of categories might be different for each month, picking the number of destination rows might be a little tricky. A simple rule is to analyze the source data a pick a month with maximum categories and use that number for destination rows.
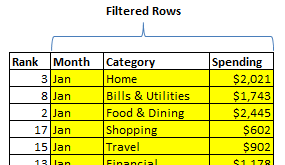
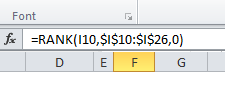
Rank Formula (F10:F26)
Apply the RANK formula on the “Spending” column of Filtered Rows.
See also: Co-Author Tip
Hard Coded Rank (K10:K26)
Hard code numbers from 1 through N (Max no. of categories). We will use this to look up values from the filtered rows range.
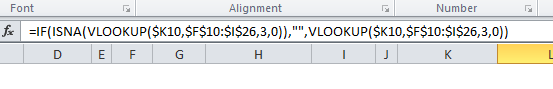
Display Data (L10:M26)
Lastly, apply VLOOKUP using the Hard coded numbers as “value” and the Filtered Rows as “table_array”. Do this to get both “Category” and “Spending”.
There you have it!
Do you know a better way to do this? Please use the comments section to share your trick. Thanks!
