Widgenie: Plugin, Create and Share Data Visualization Widgets

Widgenie is a powerful online tool to create interactive data visualization widgets using the most common data sources like Excel, CSV and Google docs. Widgenie is a division of LogiXML, a company which specializes in Business Intelligence solutions. Over the weekend i was searching for online widgets for data visualization and i bumped into this interesting tool. Here is a detailed review.

They say, if you are one of the following then Widgenie is for you:

  • A blogger who wants to make their latest poll data pop right off the page
  • A marketing rep who needs to share sales figures without waiting for IT
  • A Sales manager who wants his team to update their own client data
  • A soccer coach who needs an easier way to display the most recent stats

You need to register in order to create your widgets. Once registered, login to the your account and start creating interactive Data Visualization Widgets just by few clicks.

The first step in the process is to Create a new data file. If you have something already created it will be displayed on this page. Currently Widgenie supports MS Excel and CSV formats. Google docs option is coming soon. Interesting thing is to see if one can create live widgets using Google docs, i.e. if google doc is updated will it automatically reflect in the Widget created using the same doc. The user can upload an Excel or CSV file to be used as the data source to create the widget. Once the file is uploaded it shows up in the Data Files List. In this case we are using an Excel File.

Continue reading →

2008 Electoral College Calculator using Crystal Xcelsius

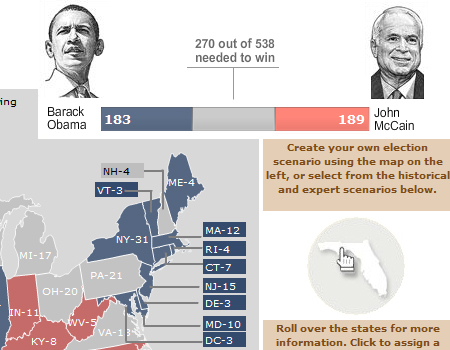
The Presidential Fight is heating up in the Swing states like Florida, Pennsylvania and Virginia. Experts are coming up with their own predictions and analysis. The other day i was on the Wall Street Journal website checking out the headlines. Like all other Xcelsius users, my attention was drawn to a nice looking graphic of the USA map. Eventually it turned out to be the 2008 Electoral Calculator. Its an interactive calculator which can be used to build your own scenario of who is going to win what states. The immediate thought that came to my mind was “Can i make a similar Calculator with Xcelsius 2008”. I thought of giving it a try and here is what i came up with.

This is a brief description about how i built it. Many Xcelsius developers should be able to understand. As you can see i used the USA Map component and i carefully placed the icon components over each state (Tedious work Phew…). The reason for the icons was to allow the user to click on a state and insert the relevant value in the cell corresponding to the State. I set Alerts for the states so that they display Red or Blue depending on the value inserted by the icon. The rest of the calculator is simple label components and other basic Xcelsius stuff. Most of the time was spent on the overall look and feel of the calculator.

List of Microsoft Excel functions supported in Xcelsius 2008

Xcelsius uses MS Excel as a base to create Interactive Dashboards. Xcelsius does not support all the functions available in MS Excel. I have put together the list of MS Excel functions that are supported by Xcelsius 2008. This list can also be found in Xcelsius User’s Guide. Following is the List.

Download Excel File here

Does Crystal Xcelsius support Excel pivot tables?

No, currently, Crystal Xcelsius does not allow Xcelsius-generated .SWF (Shockwave Flash) files to have pivot table functionality. Xcelsius does allow you to import Microsoft Excel files that have pivot table data and use that data.

For example, you can import an Excel workbook that has pivot tables and use a Table Selector component to visualize the range of cells that is the output of the pivot table. Xcelsius can then display the output of a pivot table, however it cannot recalculate. Currently, Xcelsius does not support the function GETPIVOTDATA.

Alternatively if you are trying some workaround, here is a great trick from Michael Alexander, author of “Crystal Xcelsius for Dummies” on Simulating Pivot Table Functionality in Crystal Xcelsius

Dashboard of the Week: MarkLogic Performance Monitor dashboards

MarkLogic Performance Dashboard is one of the featured dashboards on Xcelsius Xchange. The below description is straight from Xcelsius Xchange website. I found it very interesting so thought of sharing with you all.

Mark Logic Corporation is a Technology Partner of Business Objects, An SAP Company.

Mark Logic uses Xcelsius to create interactive performance dashboards leveraging its strong visualization capabilities. These visualization capabilities provide administrators with a succinct performance overview of a MarkLogic Server cluster.

From there, an administrator can zero in on any performance related issues quickly and easily. Additionally, Xcelsius’ XML capabilities facilitated rapid integration with MarkLogic. These capabilities also enable creation of Xcelsius generated dashboards that provide insight into content stored in MarkLogic in an intuitive and easy to use fashion and enhance the existing administrative interfaces available with the product. This download (and other open source MarkLogic downloads) is also available at the MarkLogic Developer website.

Mark Logic Corporation is a leading provider of information access and delivery solutions used by publishers, government agencies, and other large enterprises. The company’s flagship product, MarkLogic Server, is an XML content platform that includes a unique set of capabilities to store, aggregate, enrich, search, navigate, and dynamically deliver content. To learn more about Mark Logic, or to download a free community edition of MarkLogic Server, go to the MarkLogic website.

You can download the related files here:

Attachment Size
MPM Guide.pdf 1.02 MB
MPM.zip 3.55 MB