SP05 was kind of a milestone upgrade to SAP Dashboards. One of the most prominent and my personal favorite is the ability to export the dashboard to HTML5. However there is a small caveat to this. You can not export the HTML5 version locally to your computer, that is, you can only export it to a BOE server and then access it using the SAP Mobile BI app for iOS and Android on Tablets. Although there is no straight forward procedure to export the HTML5 version locally, here is a little trick that will allow you to do that.
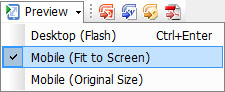
1. Preview the dashboard in Mobile mode. Make sure to leave it in preview mode until you finish steps 2 and 3