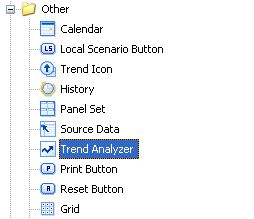
 Often many components in Xcelsius are not used to their full potential. This may be because of the generic business requirements or lack of developers knowledge on the components repository in Xcelsius 2008. One such component is the Trend Analyzer. The Trend Analyzer combines data analysis and visualization. The component analyzes the data selection and provides an additional data series that can be plotted to display a trend line. The Trend Analyzer component does not display in the visualization. You can find the Trend Analyzer under the Other Category of the Components Browser in design mode of Xcelsius 2008. If used appropriately, this component can be a powerful trick to show trends within Xcelsius based dashboards.
Below is a demonstration of Trend Analyzer. You can find the same in Xcelsius 2008 User Guide, however without screenshots.
This is what you can achieve using Trend Analyzer:
It’s Interactive:
The steps below will produce a working visualization that will demonstrate the use of Trend Analyzer:
Click below to launch the Video in a New Window.
- Download the Excel file that will be used in this Example.
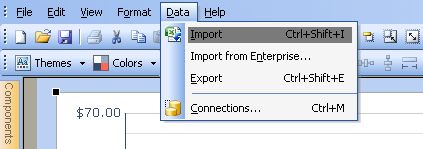
- Launch Xcelsius 2008 and Import the Downloaded Excel file.
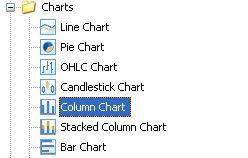
- Place a Combination Chart component on the canvas.
- Double-click the Combination Chart to open the Properties panel.
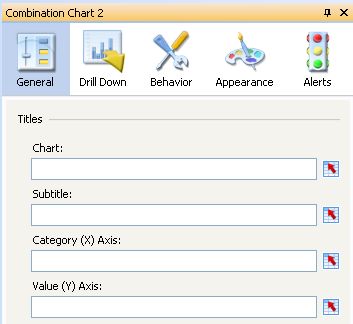
- Bind Chart Title to Cell A1 and Subtitle to Cell A2.
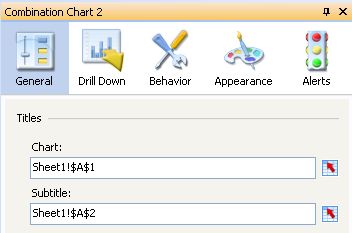
- Click Data by Series; click the plus button to add a series to the list box. Bind the ‘Name’ of the series to Cell E2.
- Click the Values (Y) cell selector button and select the Source Data for this series; for this sample, select the data under the column header “Price”.
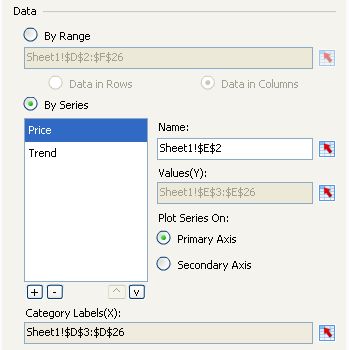
- Click the plus button to add another series to the list box. In the Name box, type “Trend”.
- Click the Values (Y) cell selector button and select the Source Data for this series; for this sample, select the empty cells under the column header “Analyzed Trend Data” (In Yellow).

- Click the Category Labels (X) cell selector button and select the data labels; for this sample select the data under the column header “Date”.
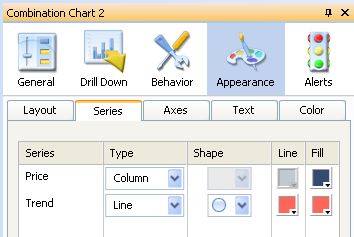
- Click the Appearance tab on the top; click the Series sub-tab.
- For the series “Price”, click the Type dropdown menu and select Column. For the series “Trend”, click the Type dropdown menu and select Line.
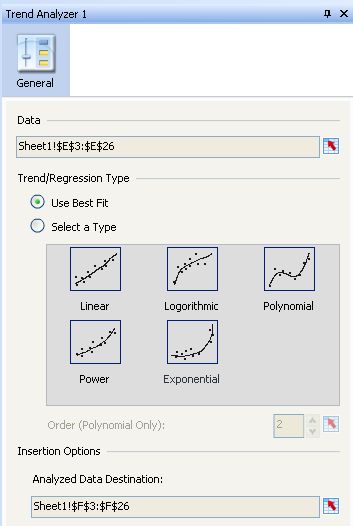
- Place a Trend Analyzer component on the canvas. Click the Trend Analyzer to open its Properties panel.
- Click the Data cell selector button and select the data to be analyzed for trending; for this sample, select the data under the column header “Price”.
- In the Trend/Regression Type section, click the Use Best Fit radio button.
- Click the Analyzed Data Destination cell selector button and select an empty range of cells for the new data series to be inserted into; for this sample, select the empty cells under the column header “Analyzed Trend Data”.
- Click Preview to view the between the Combination Chart component displayed with a trend line.

In this sample, the Trend Analyzer component analyzes the selected data and determines a the best way to display a trend line for the data.
Download Source Files:


