This is Part III of the “Live Dashboards using BO LiveOffice†Series. In Part I, Kalyan Verma Introduces LiveOffice and its connection with Xcelsius 2008. In Part II Muhammed Ismail, walks us through the steps on “How to Create a LiveOffice Document and connect it to BusinessObjects Universe dataâ€. In this final Part of the series, Muhammed walks us through the steps on How to bind Xcelsius Components to LiveOffice data and create a live dashboard.
Note: Muhammed used Xcelsius 4.5 to achieve this. He will be posting an Xcelsius 2008 version of the same procedure soon.
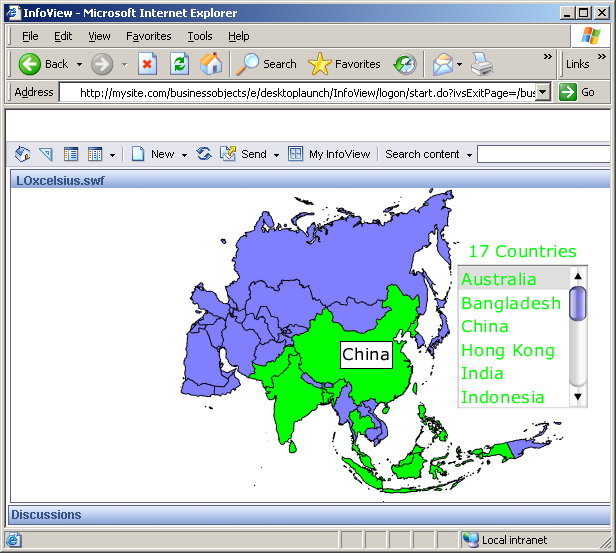
This article discussed below shows countries in the Asian region that participated in a survey. The live data is fed from the Business Objects universe; when the number of Asian countries in the universe data increases or decrease the map chart color will change and the number of countries will get updated.
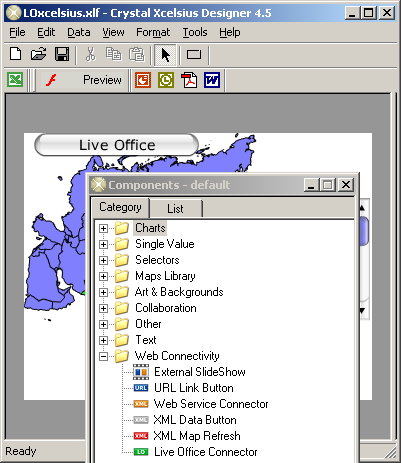
Create an Xcelsius dashboard by dragging and dropping the components you need.
Ensure the “Live Office Connector” from components is also added.
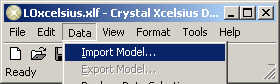
Import Excel model to Xcelsius selecting “Data”, “Import Model”
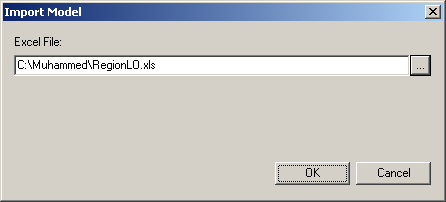
The Excel model can be specified by clicking on the square button. It should be the Excel Live Office document that was created earlier with the Business Objects Universe data.
In the “Live Office Connecter†properties, “General†tab set the Live Office Web Services URL.
Ensure “Live Office Connectionâ€, “Views†of Business Office Live Office Object is checked and the data grid populates the cells you are going to use in the visualization.

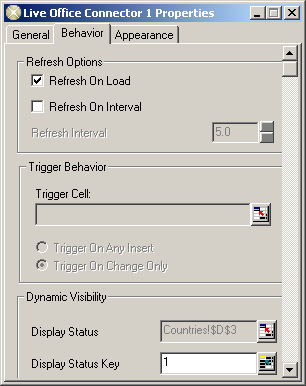
Select the tab “Behaviorâ€, then check “Refresh On Load†to load the latest Live Office data when the Xcelsius file loads.
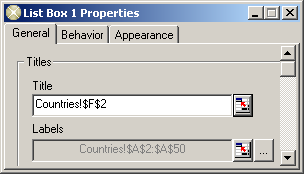
In this example, the List Box Xceslius component references the relevant cells from the Live Office Connection data.
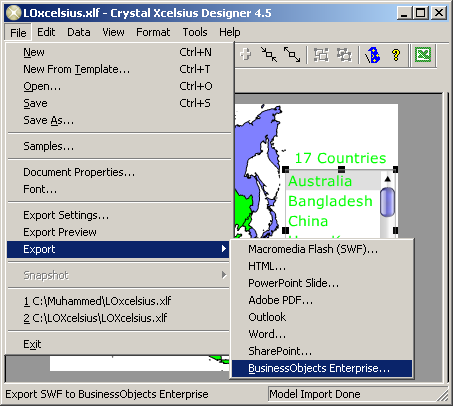
Export the Xcelsius dashboard to Infoview by selecting “Fileâ€, “Exportâ€, “BusinessObjects Enterpriseâ€
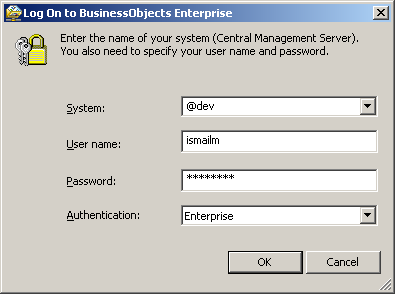
Save the Xcelsius flash file in Infoview by navigating to the relevant folder after logging into the Business Objects Infoview with your credentials.
Below is the dashboard in Business Objects Infoview getting live data from the BO universe; when the number of Asian countries in the universe data increases or decrease the map chart color will change to green and the number of countries will get updated.
Similarly a scorecard or dashboard can be populated with live data. If you have any questions related to the above post, please leave a comment or eMail me.
