In an Earlier series on Live Dashboards using BO LiveOffice, Muhammed Ismail walked us through the steps for creating Live Dashboards. This post is a small Nugget from that series. Here, Muhammed describes about using Prompts from Xcelsius, to get the data from the Universe and use the same in creating live dashboards.
The article discussed below shows countries in various regions that participated in a survey. The live data is fed from the Business Objects universe; in this example we are passing region as prompt value to get the countries from the universe. The countries returned are then shown in green.
Create an Xcelsius dashboard by dragging and dropping the components you need.

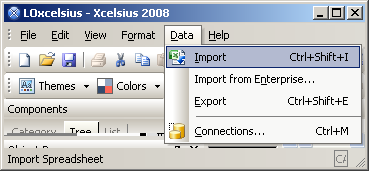
Import Excel model to Xcelsius selecting “Data”, “Import”
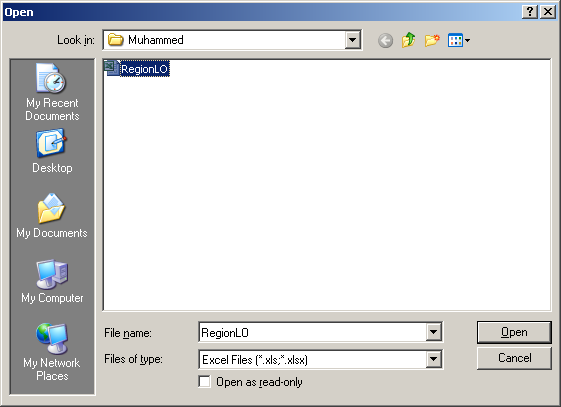
The Excel model can be specified by selecting the Excel Live Office document that was created earlier with the Business Objects Universe data.
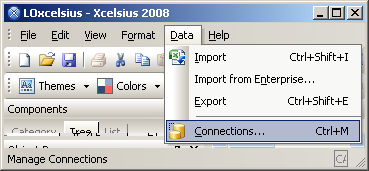
Add the “Live Office Connector” from “Data”, “Connections”
Click on “Add”, “Live Office Connections”.

Ensure the session URL is correct and the data grid populates the cells you are going to use in the visualization.
In the “Usage” Tab select “Refresh on Load” to load the latest Live Office data when the Xcelsius file loads.

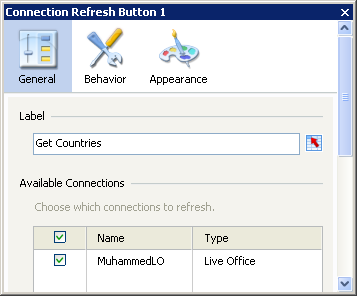
Bind the Connection Refresh Button to LiveOffice connector.
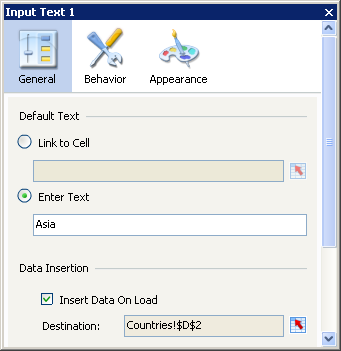
To pass prompt value, we use an Input component from Xcelsius 2008. Ensure that you select the LiveOffice prompt value cell from excel.
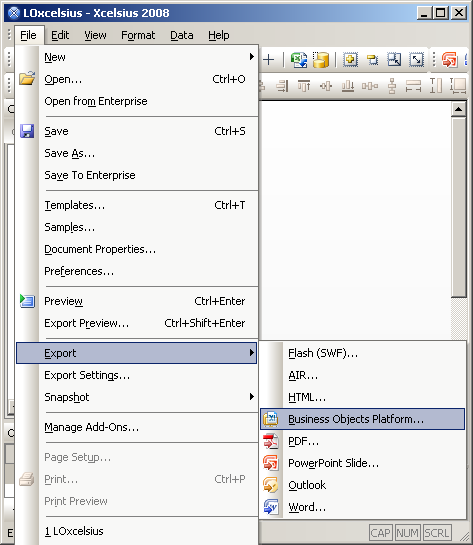
Export the Xcelsius dashboard to Infoview by selecting “File”, “Export”, “BusinessObjects Platform”
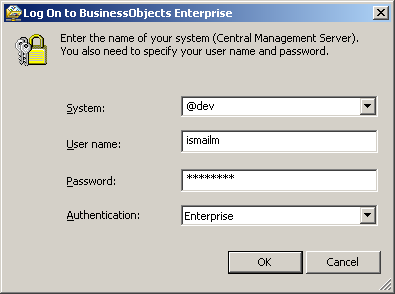
Save the Xcelsius flash file in Infoview by navigating to the relevant folder after logging into the Business Objects Infoview with your credentials.
Below is the dashboard in Business Objects Infoview getting live data from the BO universe; Depending on the region given, the countries will get updated and will be showed in green. Similarly a scorecard or dashboard can be populated with live data.

