In this Post Jim Brogden explains how to link multiple charts to a single drill down using Excel Lookups and Xcelsius 2008 chart drill down feature.
Use the Drill Down feature in combination with Excel logic to pass information from one chart to many others.
Its Interactive
Click here to see the Blown up version.
1. The first step is to either add a Column Chart to an existing Xcelsius model or edit an existing one, set the values and labels to populate the chart then select the Drill Down tab.
2. Check the ‘Enable Drill Down’ box and select Row as the Insertion Type. The Insertion Types available when enabling the Drill Down feature on a Column Chart are the following: Position, Value, Row, Column, Status List. The Position type returns the position in the order where the selected bar appears in the list. The Value type returns the value of the selected bar. This example will be using the Row type, which will return the label of the selected bar.
3. After selecting Row as the Insertion Type, point to the Source Data (the same as the charts Labels), and choose a Destination cell. This is an important cell because it will be used to identify values in the additional charts. Now that the drill-down selection is in the destination cell (B2 in this example), it will be used by a series of simple HLOOKUP formulas to identify the data associated with it to display in additional charts.
4. Cell K3 receives the dynamic value placed in B2 and will be the new charts’ heading. The cell with the first dynamic value is K4. This value is obtained through HLOOKUP by using the value in B2 and looking through the “detailed data” for a match. Once the match is found, the value in the second row is displayed. Here is the formula: =HLOOKUP($B$2,$E$3:$I$8,2,FALSE)

Utilize the Excel HLOOKUP formula
5. A second example is used that is very similar to the one above but the value is passed to cell K13 and additional HLOOKUPS are used to identify the correct values associated with K13. These values appear in cells K14:K18 and are used to create the pie chart.
6. The main chart can set a Default Selection (on the Drill Down tab in properties) which will be the subsequent drill-down value picked up by the additional charts.
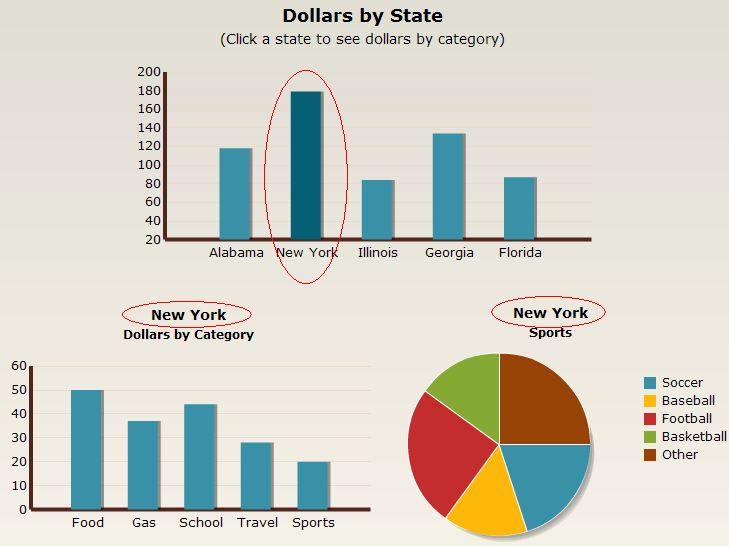
Drilling Down from Dollars by State
Feel free to send me an email if you have any questions. Thank you.
