In this post David Lai, does a brief review on Qlikview, a Visual analysis tool.
Qlikview is a great dashboarding and analysis solution that allows analysts to easily and quickly display data in a meaningful way. I would like to give a technical introduction into some of the benefits I have come across while working with Qlikview.
One thing that I like right off the bat for Qlikview is that it loads very fast. After creating a dashboard, the user has the choice of creating an AJAX version of Qlickview and this pretty much loads instantaneously. Setting up qlikview was quite easy and loading the data through an ODBC connection was easy as well. The manual provides clear instructions on accomplishing this.
Once you have your qlikview layout setup, the main way of making queries is through the selection of field values. When you make a selection, the program instantaneously shows all the field values in the document that are related to the selected field value.
To make a query, or a search, in the database, you just click on something you want to know more about. By making consecutive selections this way, it is thus possible to step by step
get closer to the answer you are looking for.
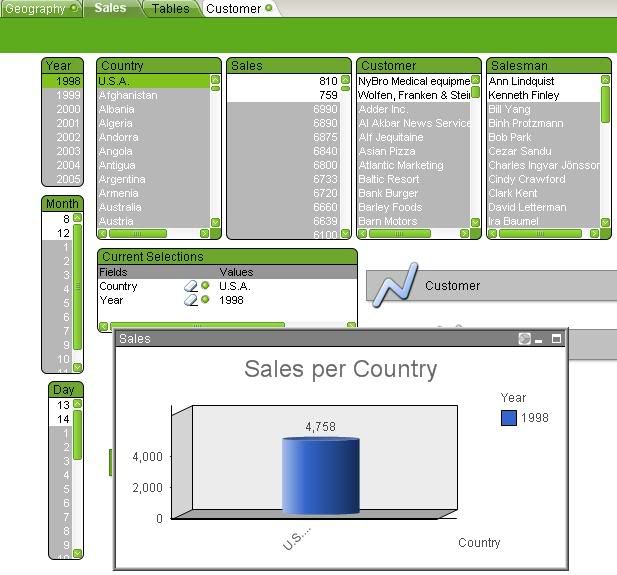
For example, in Fig 1 I wanted to select information from 1998 and Canada. All I had to do was click on 1998 from the Year listbox and U.S.A from the Country list box. I am now able to see which customers I am able to further filter on and which salesman if desired. In addition based on my filter selections, I have a chart that shows the total sales in 1998 for U.S.A.
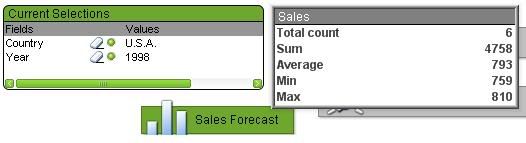
Qlikview also has some user intuitive features such as objects to display the user’s current selection and the ability to display all aggregates for a certain measure (ie: sales)
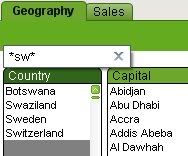
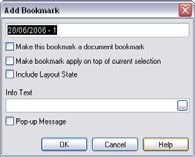
To simplify searches for users, qlikview provides an easy to use text and numeric search option that is easily accessible from clicking on the top of a listbox. In addition, some dashboards may be very complex so users have the option of bookmarking their selection. For example I can bookmark the country, year and salesperson that I have selected and access it next time. Finally if I were to make a mistake on the current selection, I can easily revert back to the previous selection since there is a history of 100 selections.
Moving from tab to tab will also save your selection so you won’t need to select everything all over again.
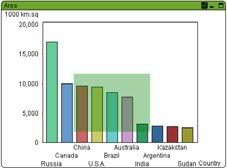
Another neat feature that qlikview has is the ability to filter the items to be displayed on your chart. For example if I wanted a chart that only shows China, USA, Brazil, Australia, and India, I could just easily perform my drag selection on the chart directly.

Furthermore, Users can easily go into the chart properties and change it to another chart type or even a pivot table.
These are just a few of the powerful things that Qlikview can accomplish with very little effort. I’ll be writing more on the advanced features of Qlikview on my next article so stay tuned.
