In just a few quick and easy steps, you can generate a thermometer chart with out of the box Xcelsius functionality.
Here is how it looks all together with a line chart to toggle the goal line.
I’ve seen a number of thermometer chart options lately, and wanted to create something that will look like my other components and will be very easy to replicate. To accomplish this, I have decided to use an existing progress bar component and a PNG image with transparency.
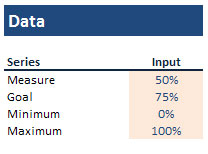
Step 1. Get some data.
Step 2. Create a PNG image with a transparent center (or use ours)
Step 3. Insert a progress bar
Step 4. Insert Image (Overlayed)
After that, you can add an elipse with transparency to make the buble shine…
Feel free to download the source files. I have also included the PNG with transparency for creating your own thermometers.


Pingback: Tweets that mention Xcelsius Thermometer Chart – MyXcelsius.Com -- Topsy.com()