‘Query as a Web Service’ (QaaWS) is a client tool that was first made available with BusinessObjects XI R2. Now with XI 3.0 and 3.1, it is quickly becoming a commonly used client tool because of its ability to interface with Xcelsius 2008 and convert your static presentations into dynamic and live visualizations.
The following set of screen shots will walk you through the process of creating a simple application that integrates QaaWS and Xcelsius 2008 within BOE XI 3.1.
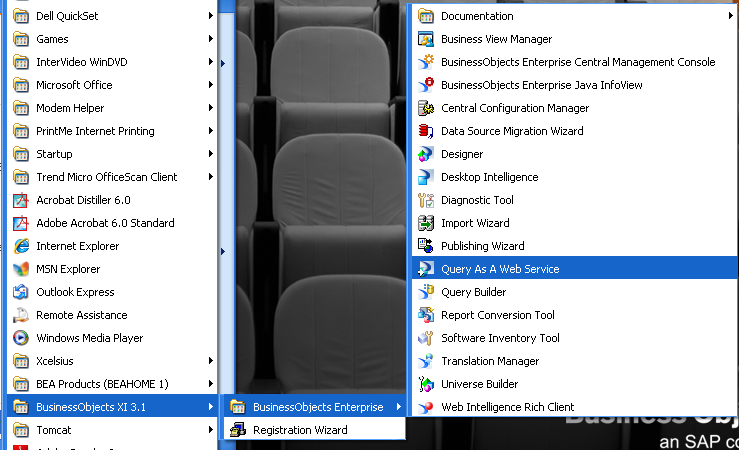
This example will include two QaaWS queries; one to provide the countries for our ListBox and a second query that will accept the selected country and provide the data for our chart. Let’s begin by opening QaaWS and creating a new Web Service query.
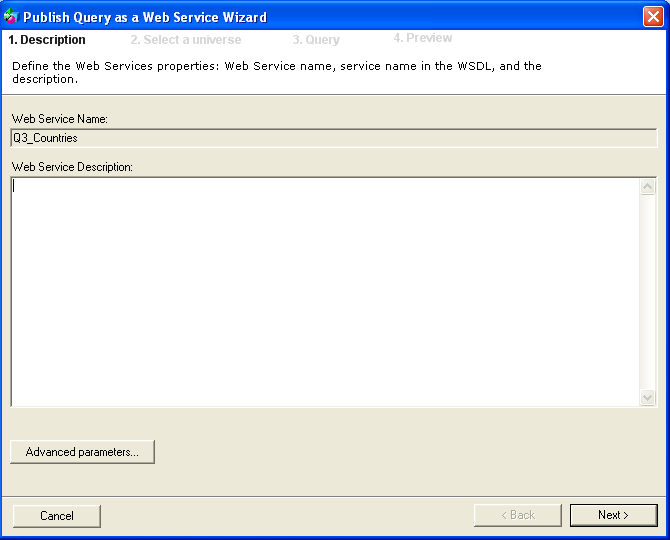
Give the Web Service a name and click ‘Next’.
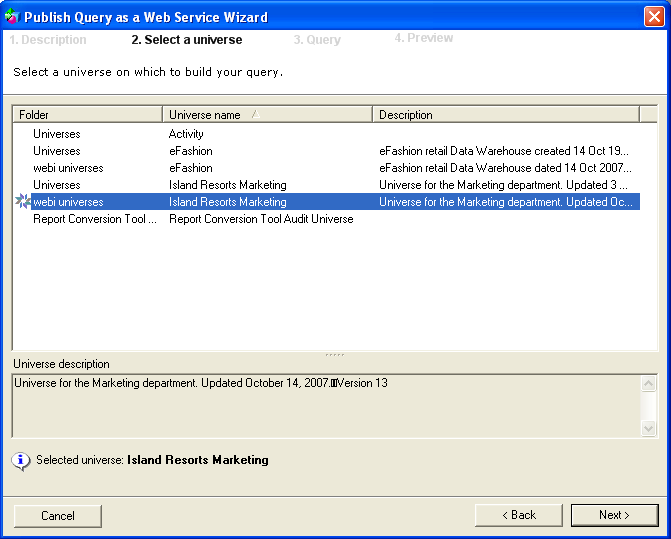
Select your Universe then click ‘Next’. This example will use the ‘Island Resorts Marketing’ Universe that ships with BOE XI 3.1.
Only the Country field is added to the ‘Result Objects’ section. Also added is a ‘Filter Object’ (predefined in the Universe).
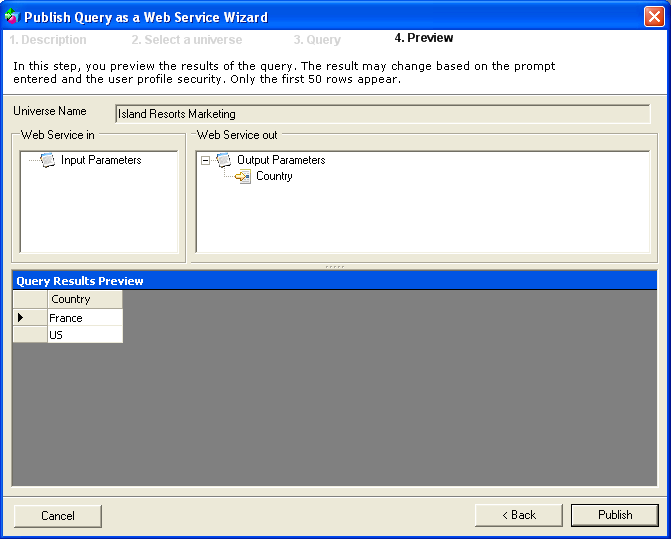
Sample data from the query is displayed after clicking ‘Next’. Click ‘Publish’ to proceed.
This screen will provide the URL for the WSDL that was just created. You can click the “To Clipboard†button to save the URL to the clipboard or simply copy the URL. The URL will be used later within Xcelsius to consume the Web Service data.
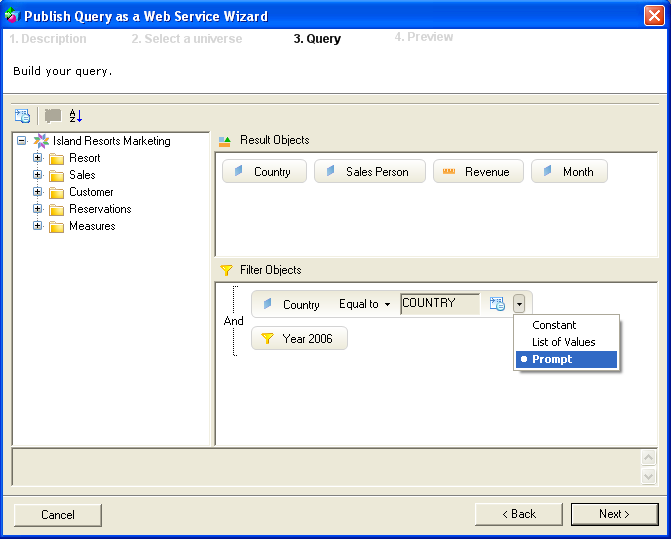
Now we’ll go back and create a new Web Service query to retrieve the Revenue data for the selected country. Just drag the country field into the ‘Filter Objects’ section then change the ‘Prompt text’ to “COUNTRYâ€. Be sure to set the type to ‘Prompt’. This will allow the Web Service query to receive data passed to it.
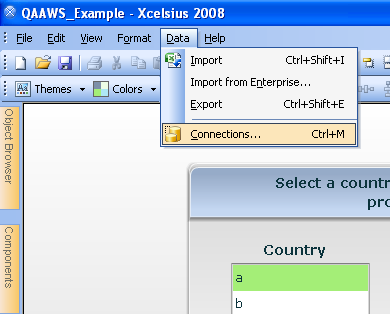
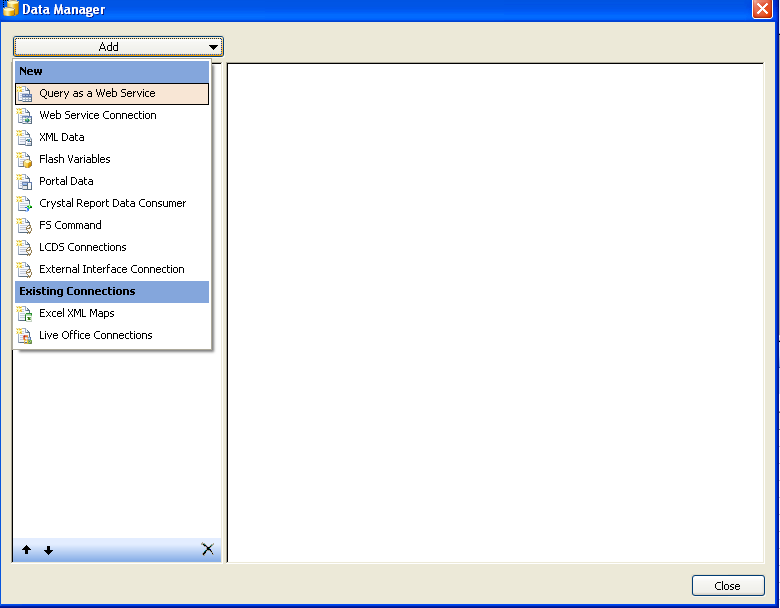
We are ready to open Xcelsius 2008 and setup our data connections. Click Data from the menu at the top then click Connections to open the Data Manager. Click the ‘Add’ drop-down then select ‘Query as a Web Service’ from the list of available connection types.
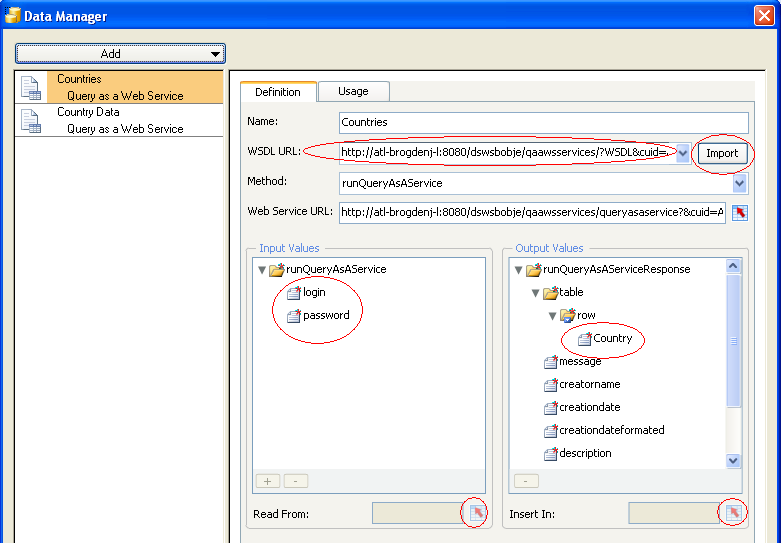
Paste the first URL that we generated in QaaWS into the WSDL URL box and click Import. This will make the connection to the data and allow Output Values to be inserted into your model by allowing the developer to point specific table and row values to cells in your model.
Be sure to color code these cells because we’ll be using them later.
Click the Country field in the ‘Output Values’ section and point the ‘Insert In’ cell range to F3:F9. (The first QaaWS connection was renamed to “Countriesâ€).
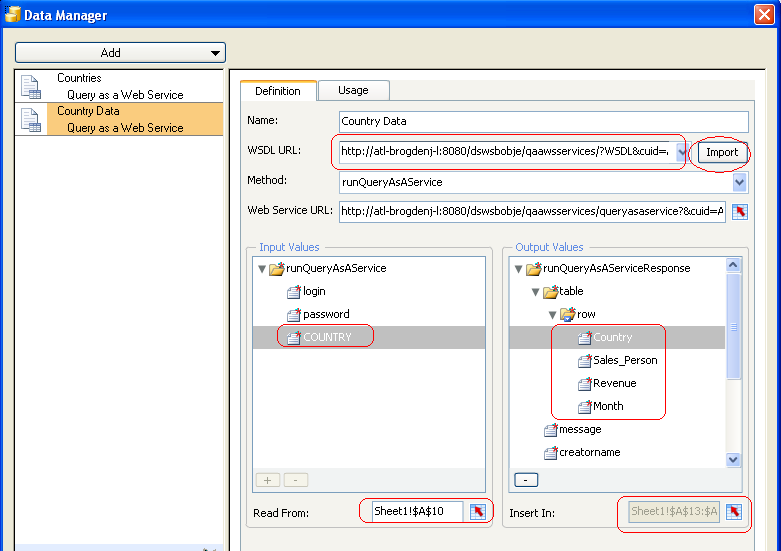
This screenshot shows our second QaaWS connection (renamed “Country Dataâ€) and shows the result of pasting our second URL into the WSDL URL, clicking Import, and seeing the fields available to be used.
In addition, we have a new “Input Values†object called “COUNTRYâ€. This was the ‘Prompt text’ value of the Country field that we added to our ‘Filter Objects’ section when building our second WSDL query. To tie the object to data being passed in, click COUNTRY then set it to ‘Read From’ cell A10 in our Xcelsius model.
Later we will set cell A10 as the Destination cell of our ListBox.
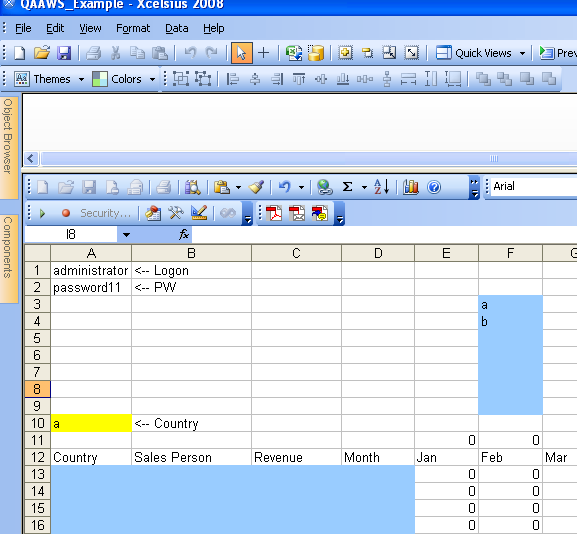
This slide shows how the Xcelsius model is color-coded with ‘Insert In’ values from our QaaWS WSDL fields.
Now add a ListBox to your Xcelsius model. Set the Labels and Source Data to F3:F9, set the Destination to cell A10 and set the Insertion Type to ‘Filtered Rows’.
Our next task is to make use of the data that we just brought into Xcelsius. The ‘Revenue’ column and a ‘Month name’ column should be used to create a chart with revenue by month. But first we will need to tie the two columns together. An excellent function to use in this situation is SUMIF().
To get the cells ready, label cells E12:P12 with month names in the same format as the month names coming into Xcelsius from QaaWS. In this case, enter the first three digits of each month name. It is time to use our SUMIF formula to search through our Month column to find the associated revenue value.
The syntax for this function is: =SUMIF($D$13:$D$71,E12$,$C$13:$C$71). Enter the formula in cell E11 and drag it all the way down the row to P11. We are ready to chart E11:P11 and use E12:P12 as the Category Labels.
Add a Column Chart to your model and set the range to cell E11 then click the ‘By Series’ heading. Click Series1 then set the Y Values to E11:P11, optionally change the Series1 name. Then set the Category Label values to cells E12:P12 or the Month names.
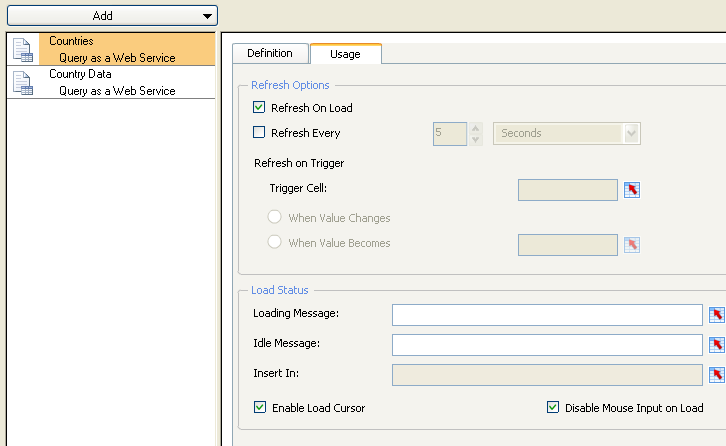
Now go back to the Data Connections. Click each ‘Query as a Web Service’ connection then click the Usage tab. On the “Countries†Web Service, check the ‘Refresh On Load’ checkbox. On the “Country Data†QaaWS connection, click the Usage tab then point the Trigger to cell A10. This will allow our prompted Web Service query to refresh every time our Xcelsius ListBox has a new Destination value.
Save your Xcelsius model then publish it to BusinessObjects Enterprise. In Qws_16 above, you can see that the BOE logon and password were in cells A1 and A2. If you tied your QaaWS ‘Input Values’ for login and password to these cells, your Xcelsius model will connect and refresh automatically without prompting the user to login. If you prefer that your Xcelsius model be more secure and require a valid BOE logon, be sure to leave these ‘Input Values’ blank.
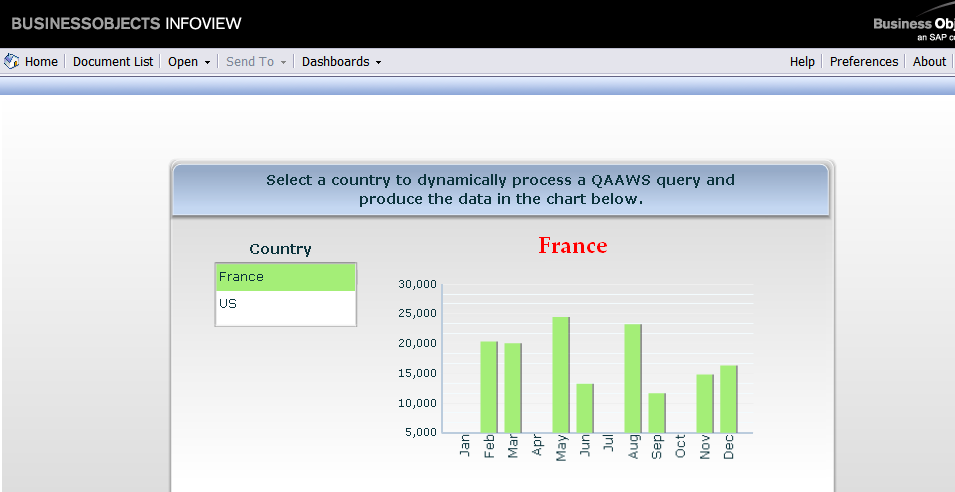
Below is a screenshot of our finished model viewed within BOE XI 3.1.
Please feel free to email me if you have any questions or comments. Thank you! - Jim Brogden

