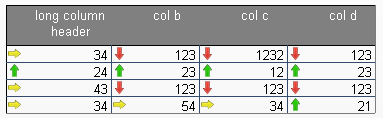
I was quite impressed with the new features released in Xcelsius 2008 SP4, especially with the new spreadsheet alerts capability. I keep asking myself, why didn’t we have this feature when they came out with the scorecard component? 🙂
Before the advent of the scorecard selector component, it was a pain to create a scorecard as you had to overlay label alerts on top of a spreadsheet table to get the traffic lighting to work. The other alternative was to use a third party addon component such as Inovista Microcharts.
When the scorecard component was added in Xcelsius 2008 SP3, it saved developers a ton of time and effort when creating scorecards for a dashboard. However, it lacked some important features that existed in the spreadsheet table component.
In this article I will write about what is available in the spreadsheet table component that is not available in the scorecard component and vice versa. Perhaps someone from SAP will see this article and glue together the missing pieces.
One of the powerful features that the spreadsheet table component has is the ability to maintain spreadsheet formatting. For example if we have a header that is word wrapped into 2 rows, we will maintain the 2 row header. Whereas the scorecard component headers are always on 1 line.
One way to overcome this problem was to overlay a spreadsheet table object on top of the header portion of the scorecard, and then hide the header. Â This however removes the column sorting functionality of the scorecard component.

Taking care of scorecard headers
In addition we can see that we can control text formatting and border formatting from the spreadsheet.
The next major annoyance that we have when using the scorecard component is the fact that we always have to manually set the column widths whenever we bind the data to the scorecard. It is a common occurance that we will rebind data multiple times during development, and from my experience the auto column width never turns out correct! When using the spreadsheet table component, the column widths and row heights are controlled from the spreadsheet. Ie: If I set my spreadsheet to have a bunch of columns at 55 pixels and a bunch of rows at 17 pixels,
it will automatically reflect when I bind the data to the spreadsheet component.

No need to change column widths everytime when rebinding data on spreadsheet
Â

Must edit column widths when rebinding data on the scorecard component
Another major advantage that the spreadsheet component has over the scorecard component is the ability to be able to dynamically change it’s row and column length. For example I can have a table that has a dynamic amount of columns and have the sizing of the table change appropriately when using ignore end blanks for rows and columns. Unfortunately, the scorecard component maintains the same size even when we ignore end blanks as shown below.
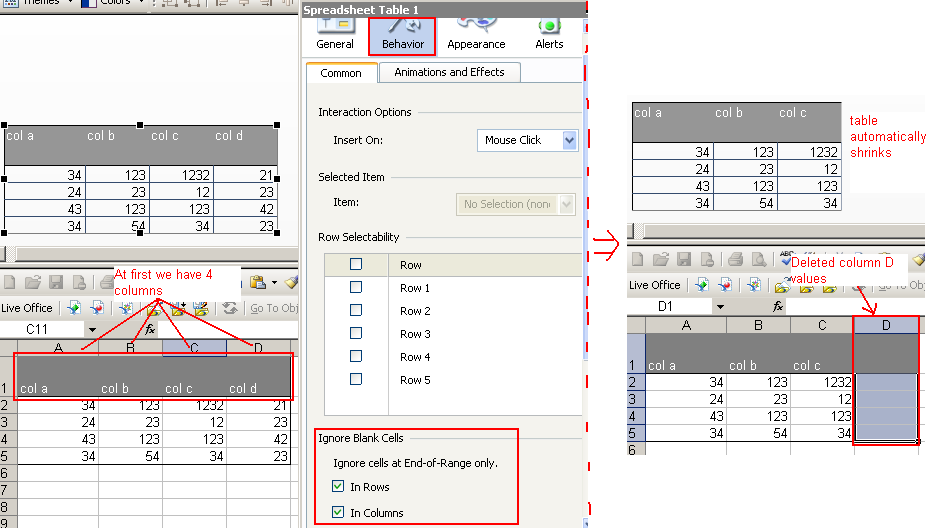
Spreadsheet table dynamically resizes

Scorecard cannot dynamically resize
The only way to accomplish dynamic columns with the scorecard component is to use multiple scorecard components and dynamic visibility, which is very troublesome. Let’s say if I have 5 column combinations, I would then have to create 5 scorecard components to emulate a table that can shrink and grow while maintaining the same column widths.
In conclusion, the spreadsheet table is a very powerful component that is commonly used in dashboards. The alerting feature on the spreadsheet table will help developers a great deal. The only items that I would like enhanced for the spreadsheet table component would be column sorting capability, and when inserting alerts to not have the column width grow (since this changes the original column width).
If anyone has any other ideas that they would like to contribute on the spreadsheet table/scorecard component, please feel free to comment below to share your ideas.

Pingback: Xcelsius 2008 SP4 | David Lai's Business Intelligence Blog()